Table of Contents
Background
Current Project Status
- 1st Sampling Campaign (2/21/2024)
- 1st Monthly Site Visit (2/20/2024)
- 2nd Monthly Site Visit (3/12/2024)
- 3rd Monthly Site Visit (4/17/2024)
- 2nd Sampling Campaign (5/14/2024)
- 4th Monthly Site Visit (5/14/2024)
- 5th Monthly Site Visit (6/13/2024)
- 6th Monthly Site Visit (7/18/2024)
- 3rd Sampling Campaign (8/14/2024)
- 7th Monthly Site Visit (8/14/2024)
- 8th Monthly Site Visit (9/17/2024)
- 9th Monthly Site Visit (10/18/2024)
- 4th Sampling Campaign (11/18/2024)
- 10th Monthly Site Visit (11/16/2024)
- 11th Monthly Site Visit (12/16/2024)
- 12th Monthly Site Visit (1/17/2025)
- 13th Monthly Site Visit (2/20/2025)
- 5th Sampling Campaign (3/5/2025)
- 14th Monthly Site Visit (3/20/2025)
- 15th Monthly Site Visit (4/17/2025)
- 6th Sampling Campaign (5/13/2025)
- 16th Monthly Site Visit (5/15/2025)
- 17th Monthly Site Visit (06/25/2025)
- 18th Monthly Site Visit ( 7/17/2025)
Phase 1- Watershed Characterization
The objective of this study is to perform a watershed characterization to determine the potential pollution sources of each watershed. The watershed characterization was achieved by developing a cyber infrastructure, and it collects a wide inventory of data to identify which one of the three waterways has a major contribution to the LLM.
Cyberinfrastructure development using the Geographic Information System (GIS) database helped to comprehend the major characteristics of each area contributing to the watershed supported by the analysis of the data collected. The watershed characterization process started with delineating the boundaries of each watershed. Then, geospatial and non-geospatial data were added to the cyberinfrastructure from numerous sources including point and nonpoint sources of pollution. Results showed that HWMD and IBWCNF watersheds were found to have a higher contribution to the water impairments to the LLM. HWMD and IBWCNF comprise the potential major sources of water quality impairments such as cultivated crops, urbanized areas, on-site sewage facilities, colonias, and wastewater effluents.
The Texas Commission provided funding for this project on Environmental Quality through the 319 Clean Water Act Program.
This report goes into depth on our discovery methods and our water characterization.
Texas Commission on Environmental Quality Characterization of Northern and Central Lower Rio Grande Valley (LRGV) Watersheds Project Deliverable ID Final Report
Phase 2- Watershed Characterization
Project Scope
- Extend Phase I Lower Rio Grande Valley-North and Central Watershed Characterization (UTRGV).
- Provide a combination of continuous and event-based monitoring (modeled after LLM-BSC WPP)
- RTHS- stream monitoring: Leverages 3 monitoring stations commissioned by TWDB-FWF
- Raymondville Drain
- Hidalgo-Willacy Main Drain
- USIBWC North Floodway
- Quarterly- water quality and hydrodynamic measurements
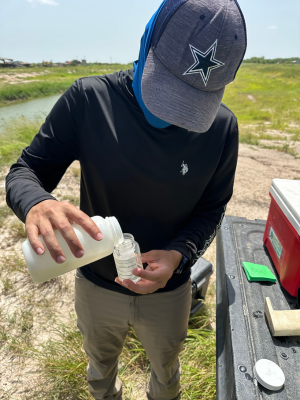
- DO, Water Temp, Conductivity, pH, Nitrate/Nitrite, Total Phosphorus, TKN, and E. coli
- ADCP discharge transects and flow measurements to develop discharge rating curves as a function of stage height
- Continuous
- Water quality
- Stream stage height
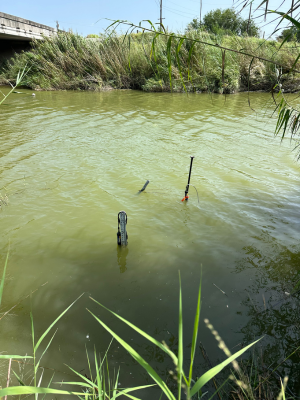
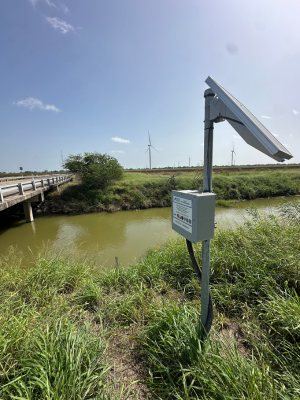
Continuous water quality data provided through this project will augment conventional routine quarterly water quality sampling programs. The availability of high-resolution time series data will: address measurement bias that characterize routine measurements; and help characterize the water quality dynamics in response to episodic events (e.g., spills, extreme weather).
Phase II contract is for 18 months of monitoring. QAPP approved August 23rd, 2024. Project durations: 24-36 months.
Project Updates
Phase 1- Partial Watershed Protection Plan (WPP) Development
Project Updates
- June – August 2026 FY26Q4
- QPR (FY26Q4)
- Invoice (FY26Q4)
- Quarterly Call Notes (FY26Q4)
- Final Monitoring QAPP Revision 1
- Documentation of education and outreach events, including materials, presentations, agendas, attendance lists, and summaries.
- Final Updated Public Participation Plan
- Stakeholder list (FY26Q4)
- Documentation of data compilation and review.
- Draft and Final e-Newsletters (FY26Q4)
Monitoring activities this quarter:
- Documentation of field monitoring readiness review before first sampling event.
- All field notes and instrument calibration sheets from first sampling event (within 30 days of event)
- Scheduled date of internal monitoring systems audit.
- Documentation of routine sampling events, in PRs
(1of6) (FY26Q4) - Continuous water quality monitoring data
submissions, with PRs (1of6) (FY26Q4) - Documentation of service visits, including QA/QC
data, data loss reports, and technician observations, minimum of two per quarter during monitoring (1of6) (FY26Q4) - Routine monitoring (SWQMIS) (1 of 6) (FY26Q4)
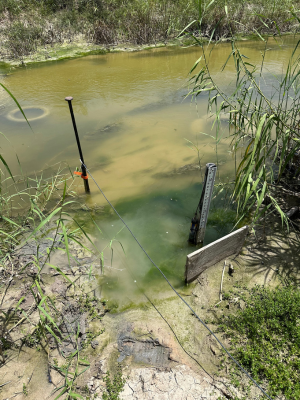
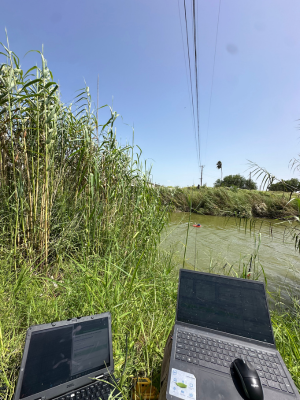
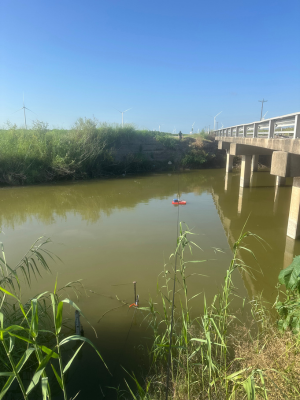
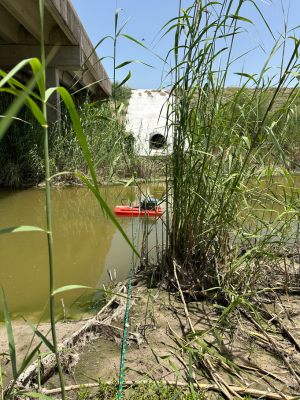
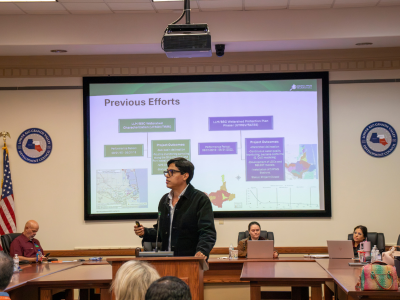
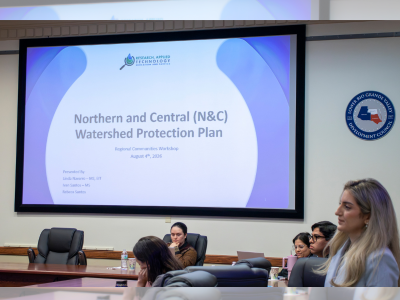
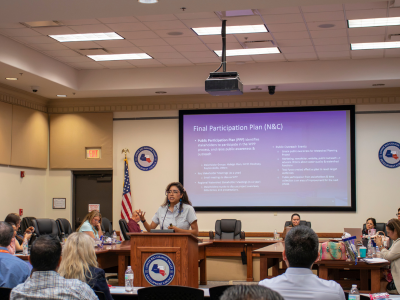
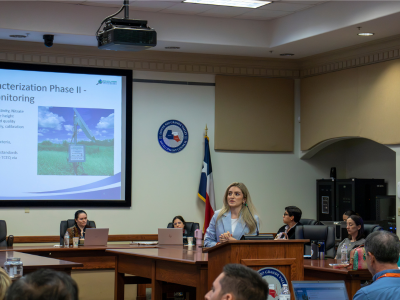
2026 Regional Communities Workshop, Weslaco TX
Our team had the opportunity to present about active projects that are relevant to our stakeholders and city representatives, such as North and Central, and Lower Laguna Madre – Brownsville Ship Channel. We are so thankful to have participated and for the networking opportunities in the workshop! Look through our social media to find out more about it!